census.world

The simulation

How a simulation works, from the census to your answer

Seven steps, each with the population’s own numbers: how a question becomes a design, how the population is built and checked, how a sample answers one profile at a time, and what you get back. Every chart below is drawn live from the build in use.

341,784,857
US residents represented
105,264
census cells matched exactly
108
attributes on every US profile
237
countries and areas
13 of 16
held-out tables within sampling
79
survey items the answers are checked against
Built fromUS Census BureauAmerican Community SurveyNHISBRFSSCurrent Population SurveyCooperative Election StudyUN Population DivisionILOSTATUNESCO UISWorld Bank
01

You ask

A question in plain words becomes a design before anyone answers: the population it is asked of, the wording each person hears, the kind of answer and its options. You see the design with the answer, so nothing is asked that you did not mean.

Name the people in the question and the population follows: adults in Ohio, parents of teenagers, the self-employed, Republicans who voted in 2024. Two populations in one question become two runs, compared side by side.

A question, and what it became

Four finished runs and their designs: the population, the wording, the kind of answer, the sample.

What would you pay a month for a streaming service?

Asked of
adults · 269 million people, one profile per thousand
Each person hears
How much would you be willing to pay per month for a streaming service?
Answers with
A number · US dollars per month
Sample
2,000 profiles, drawn to represent the population; the first hundred of every question are free

Read this answer

02

The population

Every profile starts in the census. Each state's residents by single year of age, sex, race and Hispanic origin are reproduced cell by cell from the Census Bureau's 2025 estimates; national surveys add work, income, family, housing, health, civic life, party and the 2024 vote. Every other country and area is there too, by age and sex from the UN's estimates, shallower where the data is, and every answer says so.

The charts are the population's own counts, read live from the build in use.

Everyone, by age and sex

Every resident of the United States in the population in use, by five-year band; the census, cell by cell.

00–04: women 2.6%, men 2.8%00–04: women 2.6%, men 2.8%05–09: women 2.8%, men 3.0%05–09: women 2.8%, men 3.0%10–14: women 2.9%, men 3.1%10–14: women 2.9%, men 3.1%15–19: women 3.2%, men 3.3%15–19: women 3.2%, men 3.3%20–24: women 3.3%, men 3.4%20–24: women 3.3%, men 3.4%25–29: women 3.3%, men 3.5%25–29: women 3.3%, men 3.5%30–34: women 3.4%, men 3.4%30–34: women 3.4%, men 3.4%35–39: women 3.4%, men 3.4%35–39: women 3.4%, men 3.4%40–44: women 3.3%, men 3.2%40–44: women 3.3%, men 3.2%45–49: women 3.1%, men 2.9%45–49: women 3.1%, men 2.9%50–54: women 2.9%, men 2.9%50–54: women 2.9%, men 2.9%55–59: women 3.0%, men 2.8%55–59: women 3.0%, men 2.8%60–64: women 3.2%, men 2.9%60–64: women 3.2%, men 2.9%65–69: women 3.1%, men 2.7%65–69: women 3.1%, men 2.7%70–74: women 2.7%, men 2.3%70–74: women 2.7%, men 2.3%75–79: women 2.1%, men 1.7%75–79: women 2.1%, men 1.7%80–84: women 1.3%, men 1.0%80–84: women 1.3%, men 1.0%85+: women 1.3%, men 0.8%85+: women 1.3%, men 0.8%
00–0410–1420–2430–3440–4450–5460–6470–7480–841.8%3.5%1.8%3.5%
women, 50.8% men, 49.2%share of everyone, by five-year band

A bachelor's degree or more, adults 25 and over

One attribute from the survey record, read live for every state; the population is raked so each state matches its published table.

24%68%outlined: fewer than 10 profiles
Every attribute, with its source and the share of people in each value

Open a family, then an attribute, to see its values and how the population splits across them; the tree goes deeper where the data does.

Who they are

From

US Census Bureau population estimates, 2025

Every state by single year of age, sex, race and Hispanic origin, reproduced cell by cell.

School and work

From

American Community Survey 2024, calibrated to published tables

Money and home

From

American Community Survey 2024, the person’s own household

Origin and service

From

American Community Survey 2024

Health and habits

From

National Health Interview Survey 2024 and the Behavioral Risk Factor Surveillance System 2024, by state

Drawn for every adult from survey distributions by sex, age, race and education, fitted to each state.

Civic life

From

Current Population Survey supplements: voting and registration (November 2024), civic engagement and volunteering (September 2023); the Cooperative Election Study 2024 for party, ideology and the presidential vote

Drawn from each supplement’s distributions by state, sex and age band; the voting rates match the Census Bureau’s published figures.

Elsewhere in the world

Every country and area by age and sex, with fewer attributes than the United States.

Who they are

From

United Nations World Population Prospects 2024

Work and school

From

International Labour Organization and UNESCO statistics

Everyday traits

From

World Bank and WHO country rates

03

One person, one record

A profile is not a list of independent traits. Each one is a real survey respondent's anonymised record, reweighted so that every state's totals match the published tables, so that age, work, income, family and health hold together the way they did in one life. No profile is a real person; every profile is built from one.

The curves show why that matters: employment by age for women and for men, with the shape the survey carries, because the joint was never taken apart.

One profile, as the model reads it

A record from the population in use: the attributes it carries, and the persona written from them and nothing else.

Woman, 35, Ohio · healthcare practitioners technical
synthetic; built from one anonymised survey record
Age
35
Sex
female
State
Ohio
Race, origin
asian
Education
bachelor
Work
employed
Occupation
healthcare practitioners technical
Personal income
$73,098
Household income
$79,190
Marital status
married
Household
4 people
Home
rented
Insured
yes
Health, self-rated
excellent
Party
independent
Ideology
moderate
2024 vote
Volunteered
no

As the model reads it
a 35-year-old woman living in Franklin County, Ohio; Asian; highest education: a bachelor's degree; occupation: registered nurses, in general medical and surgical hospitals, and specialty hospitals, at a nonprofit; personal income about $73,000 a year (from wages); married; born in Philippines, in the US since 2022, not a US citizen; speaks Tagalog at home, speaks English very well; insured through an employer plan; works about 36 hours a week; commutes about 10 minutes by car; degree in Nursing; household of 4 (with spouse and children) in a rented apartment; household income about $79,000; 2 vehicles; lives in the countryside; drinks alcohol; rates their own health as excellent; has been told they have blood sugar in the prediabetes range; is overweight; got no exercise in the past month; sleeps about 7 hours a night; a political independent; politically moderate; in the past year belongs to a group or association

Employed, by age: women and men

The population's own counts. Two traits that move together with a third, kept together because every profile is one record.

16–19: women 36% employed20–24: women 70% employed25–29: women 77% employed30–34: women 79% employed35–39: women 76% employed40–44: women 77% employed45–49: women 77% employed50–54: women 76% employed55–59: women 69% employed60–64: women 54% employed65–69: women 31% employed70–74: women 16% employed75–79: women 9% employed80–84: women 4% employed16–19: men 31% employed20–24: men 68% employed25–29: men 81% employed30–34: men 84% employed35–39: men 84% employed40–44: men 84% employed45–49: men 84% employed50–54: men 84% employed55–59: men 77% employed60–64: men 64% employed65–69: men 39% employed70–74: men 22% employed75–79: men 14% employed80–84: men 9% employed
0%25%50%75%100%16–1925–2935–3945–4955–5965–6975–79women 79%men 84%
women menshare employed, by five-year band
04

Checked

Tables the build never used are predicted afterwards and scored, state by state, against what sampling alone would give. Attitudes are not attributes; they come from the simulation, and every kind of question is checked against real survey answers, item by item, within demographic groups. Ten open prediction markets were asked as expectation questions. Every number is public, misses included.

Where a kind of question has not been checked yet, the answer page says so in the sentence that gives the interval.

Tables held out of the build

Each table the build never fitted, predicted afterwards and scored state by state; the median across the fifty states and the District of Columbia. A dot inside its band is a table reproduced as well as a sample of that size can be. Every check, with its number.

0.000.100.21
sex × age group × employment
0.182
sex × marital status 15+
0.055
sex × age group × veteran status, civilian 18+
0.084
sex × age group × health insurance
0.094
sex × age group × disability
0.081
citizenship status
0.029
sex × occupation group, civilian employed
0.126
sex × industry group, civilian employed
0.114
commute mode, workers
0.040
enrolled in school, 3 and over
0.012
language spoken at home by English ability, 5 and over
0.044
ratio of income to the poverty line, seven bands
0.028
sex × class of worker, civilian employed
0.056
travel time to work, twelve bands, workers not at home
0.079
sex × moved in the past year, 1 and over
0.012
birth in the past year, women 15 to 50
0.007
the error (SRMSE) what sampling alone gives beyond sampling

How far answers sit from real surveys

Each kind of question put to the population and compared with the 2024 General Social Survey and the 2024 Cooperative Election Study, item by item; the median distance in points.

010203040
Yes or no · 24 items
11 pts
Choice · 48 items
21 pts
Scale · 3 items
32 pts
Amount · 3 items
34 pts
Ranking · 1 item
26 pts
Allocation
not yet checked against a real survey
within demographic groups nationallypoints of distance from real answers; zero is a perfect match

Against prediction markets

10 open markets asked as expectation questions, three hundred profiles each; the population's yes among those with a view beside the price traders paid. The population sat above the market on 7 of 10.

0%25%50%75%100%
Will the Federal Reserve Hike rates by 0bps at…
49% / 76%
Will the Federal Reserve Hike rates by 25bps a…
50% / 60%
Will the rate of CPI inflation be above 3.3% f…
61% / 55%
Will above 100000 jobs be added in September 2…
25% / 85%
Will **real GDP** increase by more than 2.0% i…
67% / 64%
Will Donald Trump's approval rating on approva…
33% / 64%
Will Trump invoke the Insurrection Act during…
17% / 49%
When will OpenAI IPO?
14% / 66%
Will Zohran Mamdani be Time Person of the Year…
32% / 30%
Avengers: Doomsday Rotten Tomatoes score?
28% / 48%
market price population 95% intervals
05

Asked one at a time

A representative sample is drawn from the population. Each profile answers as itself, in batches of ten, and the estimate settles with its interval as more people are asked; the first hundred of every question are free. Then some of the people asked explain why in their own words, and the kinds of people in an answer are read out of the reasons.

The estimate settles

What would you pay a month for a streaming service?”: the running estimate after each batch of ten, with its 95% interval, over 2,000 profiles.

10 profiles: 11.4 (7.0 to 15.8)20 profiles: 11.5 (9.2 to 13.9)30 profiles: 13.2 (10.7 to 15.8)40 profiles: 12.7 (10.5 to 14.8)50 profiles: 13.3 (11.3 to 15.2)60 profiles: 14.2 (12.4 to 16.0)70 profiles: 14.3 (12.7 to 16.0)80 profiles: 13.8 (12.2 to 15.3)90 profiles: 13.6 (12.2 to 15.0)100 profiles: 13.8 (12.5 to 15.1)110 profiles: 13.6 (12.3 to 14.8)120 profiles: 13.5 (12.3 to 14.7)130 profiles: 13.8 (12.7 to 15.0)140 profiles: 15.0 (13.4 to 16.5)150 profiles: 15.0 (13.5 to 16.4)160 profiles: 14.9 (13.5 to 16.2)170 profiles: 14.8 (13.4 to 16.1)180 profiles: 14.6 (13.3 to 15.8)190 profiles: 14.5 (13.3 to 15.7)200 profiles: 14.5 (13.3 to 15.6)210 profiles: 14.5 (13.4 to 15.6)220 profiles: 14.5 (13.5 to 15.6)230 profiles: 14.6 (13.6 to 15.7)240 profiles: 14.6 (13.6 to 15.6)250 profiles: 14.5 (13.5 to 15.5)260 profiles: 14.7 (13.7 to 15.7)270 profiles: 14.7 (13.7 to 15.7)280 profiles: 14.7 (13.7 to 15.6)290 profiles: 14.6 (13.7 to 15.5)300 profiles: 14.6 (13.7 to 15.5)310 profiles: 14.5 (13.6 to 15.4)320 profiles: 14.5 (13.6 to 15.4)330 profiles: 14.6 (13.7 to 15.4)340 profiles: 14.5 (13.7 to 15.4)350 profiles: 14.4 (13.6 to 15.3)360 profiles: 14.5 (13.7 to 15.3)370 profiles: 14.5 (13.7 to 15.3)380 profiles: 14.6 (13.8 to 15.4)390 profiles: 14.5 (13.8 to 15.3)400 profiles: 14.5 (13.7 to 15.3)410 profiles: 14.5 (13.8 to 15.3)420 profiles: 14.5 (13.8 to 15.2)430 profiles: 14.4 (13.7 to 15.2)440 profiles: 14.4 (13.7 to 15.1)450 profiles: 14.5 (13.8 to 15.2)460 profiles: 14.4 (13.7 to 15.1)470 profiles: 14.5 (13.8 to 15.1)480 profiles: 14.5 (13.8 to 15.2)490 profiles: 14.5 (13.9 to 15.2)500 profiles: 14.6 (14.0 to 15.3)510 profiles: 14.7 (14.0 to 15.3)520 profiles: 14.7 (14.0 to 15.3)530 profiles: 14.7 (14.1 to 15.4)540 profiles: 14.7 (14.0 to 15.3)550 profiles: 14.7 (14.0 to 15.3)560 profiles: 14.8 (14.1 to 15.4)570 profiles: 14.8 (14.1 to 15.4)580 profiles: 14.8 (14.2 to 15.4)590 profiles: 14.8 (14.2 to 15.4)600 profiles: 14.8 (14.2 to 15.4)610 profiles: 14.8 (14.2 to 15.4)620 profiles: 14.8 (14.2 to 15.4)630 profiles: 14.8 (14.2 to 15.4)640 profiles: 14.8 (14.2 to 15.4)650 profiles: 14.8 (14.2 to 15.4)660 profiles: 14.8 (14.2 to 15.4)670 profiles: 14.8 (14.2 to 15.4)680 profiles: 14.8 (14.2 to 15.4)690 profiles: 14.8 (14.3 to 15.4)700 profiles: 14.9 (14.3 to 15.4)710 profiles: 14.8 (14.3 to 15.4)720 profiles: 14.8 (14.2 to 15.3)730 profiles: 14.8 (14.2 to 15.3)740 profiles: 14.8 (14.3 to 15.4)750 profiles: 14.8 (14.3 to 15.3)760 profiles: 14.8 (14.3 to 15.4)770 profiles: 14.8 (14.3 to 15.4)780 profiles: 14.9 (14.3 to 15.4)790 profiles: 14.8 (14.3 to 15.3)800 profiles: 14.8 (14.3 to 15.3)810 profiles: 14.9 (14.3 to 15.4)820 profiles: 14.8 (14.3 to 15.3)830 profiles: 14.8 (14.3 to 15.3)840 profiles: 14.8 (14.3 to 15.3)850 profiles: 14.8 (14.3 to 15.3)860 profiles: 14.8 (14.3 to 15.3)870 profiles: 14.7 (14.2 to 15.2)880 profiles: 14.7 (14.2 to 15.2)890 profiles: 14.7 (14.2 to 15.2)900 profiles: 14.7 (14.2 to 15.2)910 profiles: 14.7 (14.2 to 15.2)920 profiles: 14.8 (14.3 to 15.3)930 profiles: 14.8 (14.3 to 15.3)940 profiles: 14.8 (14.3 to 15.2)950 profiles: 14.8 (14.3 to 15.2)960 profiles: 14.8 (14.3 to 15.3)970 profiles: 14.8 (14.3 to 15.3)980 profiles: 14.8 (14.4 to 15.3)990 profiles: 14.8 (14.4 to 15.3)1000 profiles: 14.8 (14.4 to 15.3)1010 profiles: 14.8 (14.4 to 15.3)1020 profiles: 14.8 (14.4 to 15.3)1030 profiles: 14.9 (14.4 to 15.3)1040 profiles: 14.9 (14.4 to 15.3)1050 profiles: 14.9 (14.4 to 15.3)1060 profiles: 14.9 (14.4 to 15.3)1070 profiles: 14.8 (14.4 to 15.3)1080 profiles: 14.8 (14.4 to 15.3)1090 profiles: 14.8 (14.4 to 15.3)1100 profiles: 14.8 (14.4 to 15.3)1110 profiles: 14.8 (14.4 to 15.3)1120 profiles: 14.8 (14.4 to 15.3)1130 profiles: 14.8 (14.4 to 15.3)1140 profiles: 14.8 (14.4 to 15.2)1150 profiles: 14.8 (14.4 to 15.2)1160 profiles: 14.8 (14.4 to 15.2)1170 profiles: 14.8 (14.4 to 15.2)1180 profiles: 14.8 (14.4 to 15.2)1190 profiles: 14.8 (14.4 to 15.2)1200 profiles: 14.8 (14.4 to 15.2)1210 profiles: 14.8 (14.4 to 15.2)1220 profiles: 14.8 (14.4 to 15.2)1230 profiles: 14.8 (14.4 to 15.2)1240 profiles: 14.8 (14.3 to 15.2)1250 profiles: 14.8 (14.4 to 15.2)1260 profiles: 14.8 (14.4 to 15.2)1270 profiles: 14.8 (14.3 to 15.2)1280 profiles: 14.7 (14.3 to 15.1)1290 profiles: 14.7 (14.3 to 15.1)1300 profiles: 14.7 (14.3 to 15.1)1310 profiles: 14.7 (14.3 to 15.1)1320 profiles: 14.7 (14.3 to 15.1)1330 profiles: 14.7 (14.3 to 15.1)1340 profiles: 14.7 (14.3 to 15.1)1350 profiles: 14.7 (14.3 to 15.1)1360 profiles: 14.7 (14.3 to 15.1)1370 profiles: 14.8 (14.4 to 15.1)1380 profiles: 14.8 (14.4 to 15.1)1390 profiles: 14.8 (14.4 to 15.1)1400 profiles: 14.7 (14.4 to 15.1)1410 profiles: 14.7 (14.4 to 15.1)1420 profiles: 14.7 (14.4 to 15.1)1430 profiles: 14.7 (14.3 to 15.1)1440 profiles: 14.8 (14.4 to 15.1)1450 profiles: 14.8 (14.4 to 15.1)1460 profiles: 14.7 (14.4 to 15.1)1470 profiles: 14.7 (14.4 to 15.1)1480 profiles: 14.7 (14.3 to 15.1)1490 profiles: 14.7 (14.4 to 15.1)1500 profiles: 14.7 (14.4 to 15.1)1510 profiles: 14.7 (14.3 to 15.1)1520 profiles: 14.7 (14.3 to 15.1)1530 profiles: 14.7 (14.4 to 15.1)1540 profiles: 14.7 (14.4 to 15.1)1550 profiles: 14.7 (14.4 to 15.1)1560 profiles: 14.7 (14.3 to 15.1)1570 profiles: 14.7 (14.3 to 15.1)1580 profiles: 14.7 (14.3 to 15.0)1590 profiles: 14.7 (14.3 to 15.0)1600 profiles: 14.7 (14.3 to 15.0)1610 profiles: 14.7 (14.3 to 15.0)1620 profiles: 14.7 (14.3 to 15.0)1630 profiles: 14.7 (14.3 to 15.0)1640 profiles: 14.7 (14.3 to 15.0)1650 profiles: 14.7 (14.3 to 15.0)1660 profiles: 14.7 (14.3 to 15.0)1670 profiles: 14.6 (14.3 to 15.0)1680 profiles: 14.7 (14.3 to 15.0)1690 profiles: 14.7 (14.3 to 15.0)1700 profiles: 14.7 (14.3 to 15.0)1710 profiles: 14.7 (14.3 to 15.0)1720 profiles: 14.7 (14.3 to 15.0)1730 profiles: 14.6 (14.3 to 15.0)1740 profiles: 14.6 (14.3 to 15.0)1750 profiles: 14.6 (14.3 to 15.0)1760 profiles: 14.6 (14.3 to 15.0)1770 profiles: 14.6 (14.3 to 15.0)1780 profiles: 14.6 (14.3 to 14.9)1790 profiles: 14.6 (14.3 to 14.9)1800 profiles: 14.6 (14.3 to 15.0)1810 profiles: 14.6 (14.3 to 14.9)1820 profiles: 14.6 (14.3 to 14.9)1830 profiles: 14.6 (14.3 to 14.9)1840 profiles: 14.6 (14.3 to 14.9)1850 profiles: 14.6 (14.3 to 14.9)1860 profiles: 14.6 (14.2 to 14.9)1870 profiles: 14.6 (14.2 to 14.9)1880 profiles: 14.5 (14.2 to 14.9)1890 profiles: 14.5 (14.2 to 14.9)1900 profiles: 14.5 (14.2 to 14.9)1910 profiles: 14.5 (14.2 to 14.8)1920 profiles: 14.5 (14.2 to 14.8)1930 profiles: 14.5 (14.2 to 14.9)1940 profiles: 14.5 (14.2 to 14.9)1950 profiles: 14.5 (14.2 to 14.8)1960 profiles: 14.5 (14.2 to 14.8)1970 profiles: 14.5 (14.2 to 14.9)1980 profiles: 14.5 (14.2 to 14.8)1990 profiles: 14.5 (14.2 to 14.8)2000 profiles: 14.5 (14.2 to 14.8)
4.711.818.950010001500200014.5
95% interval

In their own words

Two of the people asked, with their answers, from the same run.

No job, no room for subscriptions.
Man, 26, Oregon · looking for work0
Seven dollars is about all I can spare from my monthly bills.
Woman, 75, Florida · not working7

The kinds of people in this answer

Too little money to subscribe

31%

23% to 40% of the sample of 120 · typically 7.08 US dollars per month

Who they are. They range from young adults to people in their eighties, with many not working or looking for work and describing very limited or fixed budgets.

What they say. They cannot spare money for another subscription, or can spare only a few dollars for entertainment.

No room in my budget.

Man, 26, Oregon · looking for work · 0

Regular use, careful spending

27%

20% to 35% of the sample of 120 · typically 17.29 US dollars per month

Who they are. They are adults from their twenties through seventies who often watch after work or with a spouse, while still keeping an eye on other monthly bills.

What they say. They will pay around fifteen to twenty dollars because they use streaming frequently, but they do not want the bill to grow much larger.

After work, streaming is how I unwind, and eighteen is reasonable for a service I use every day.

Man, 56, Pennsylvania · 18

06

What comes back

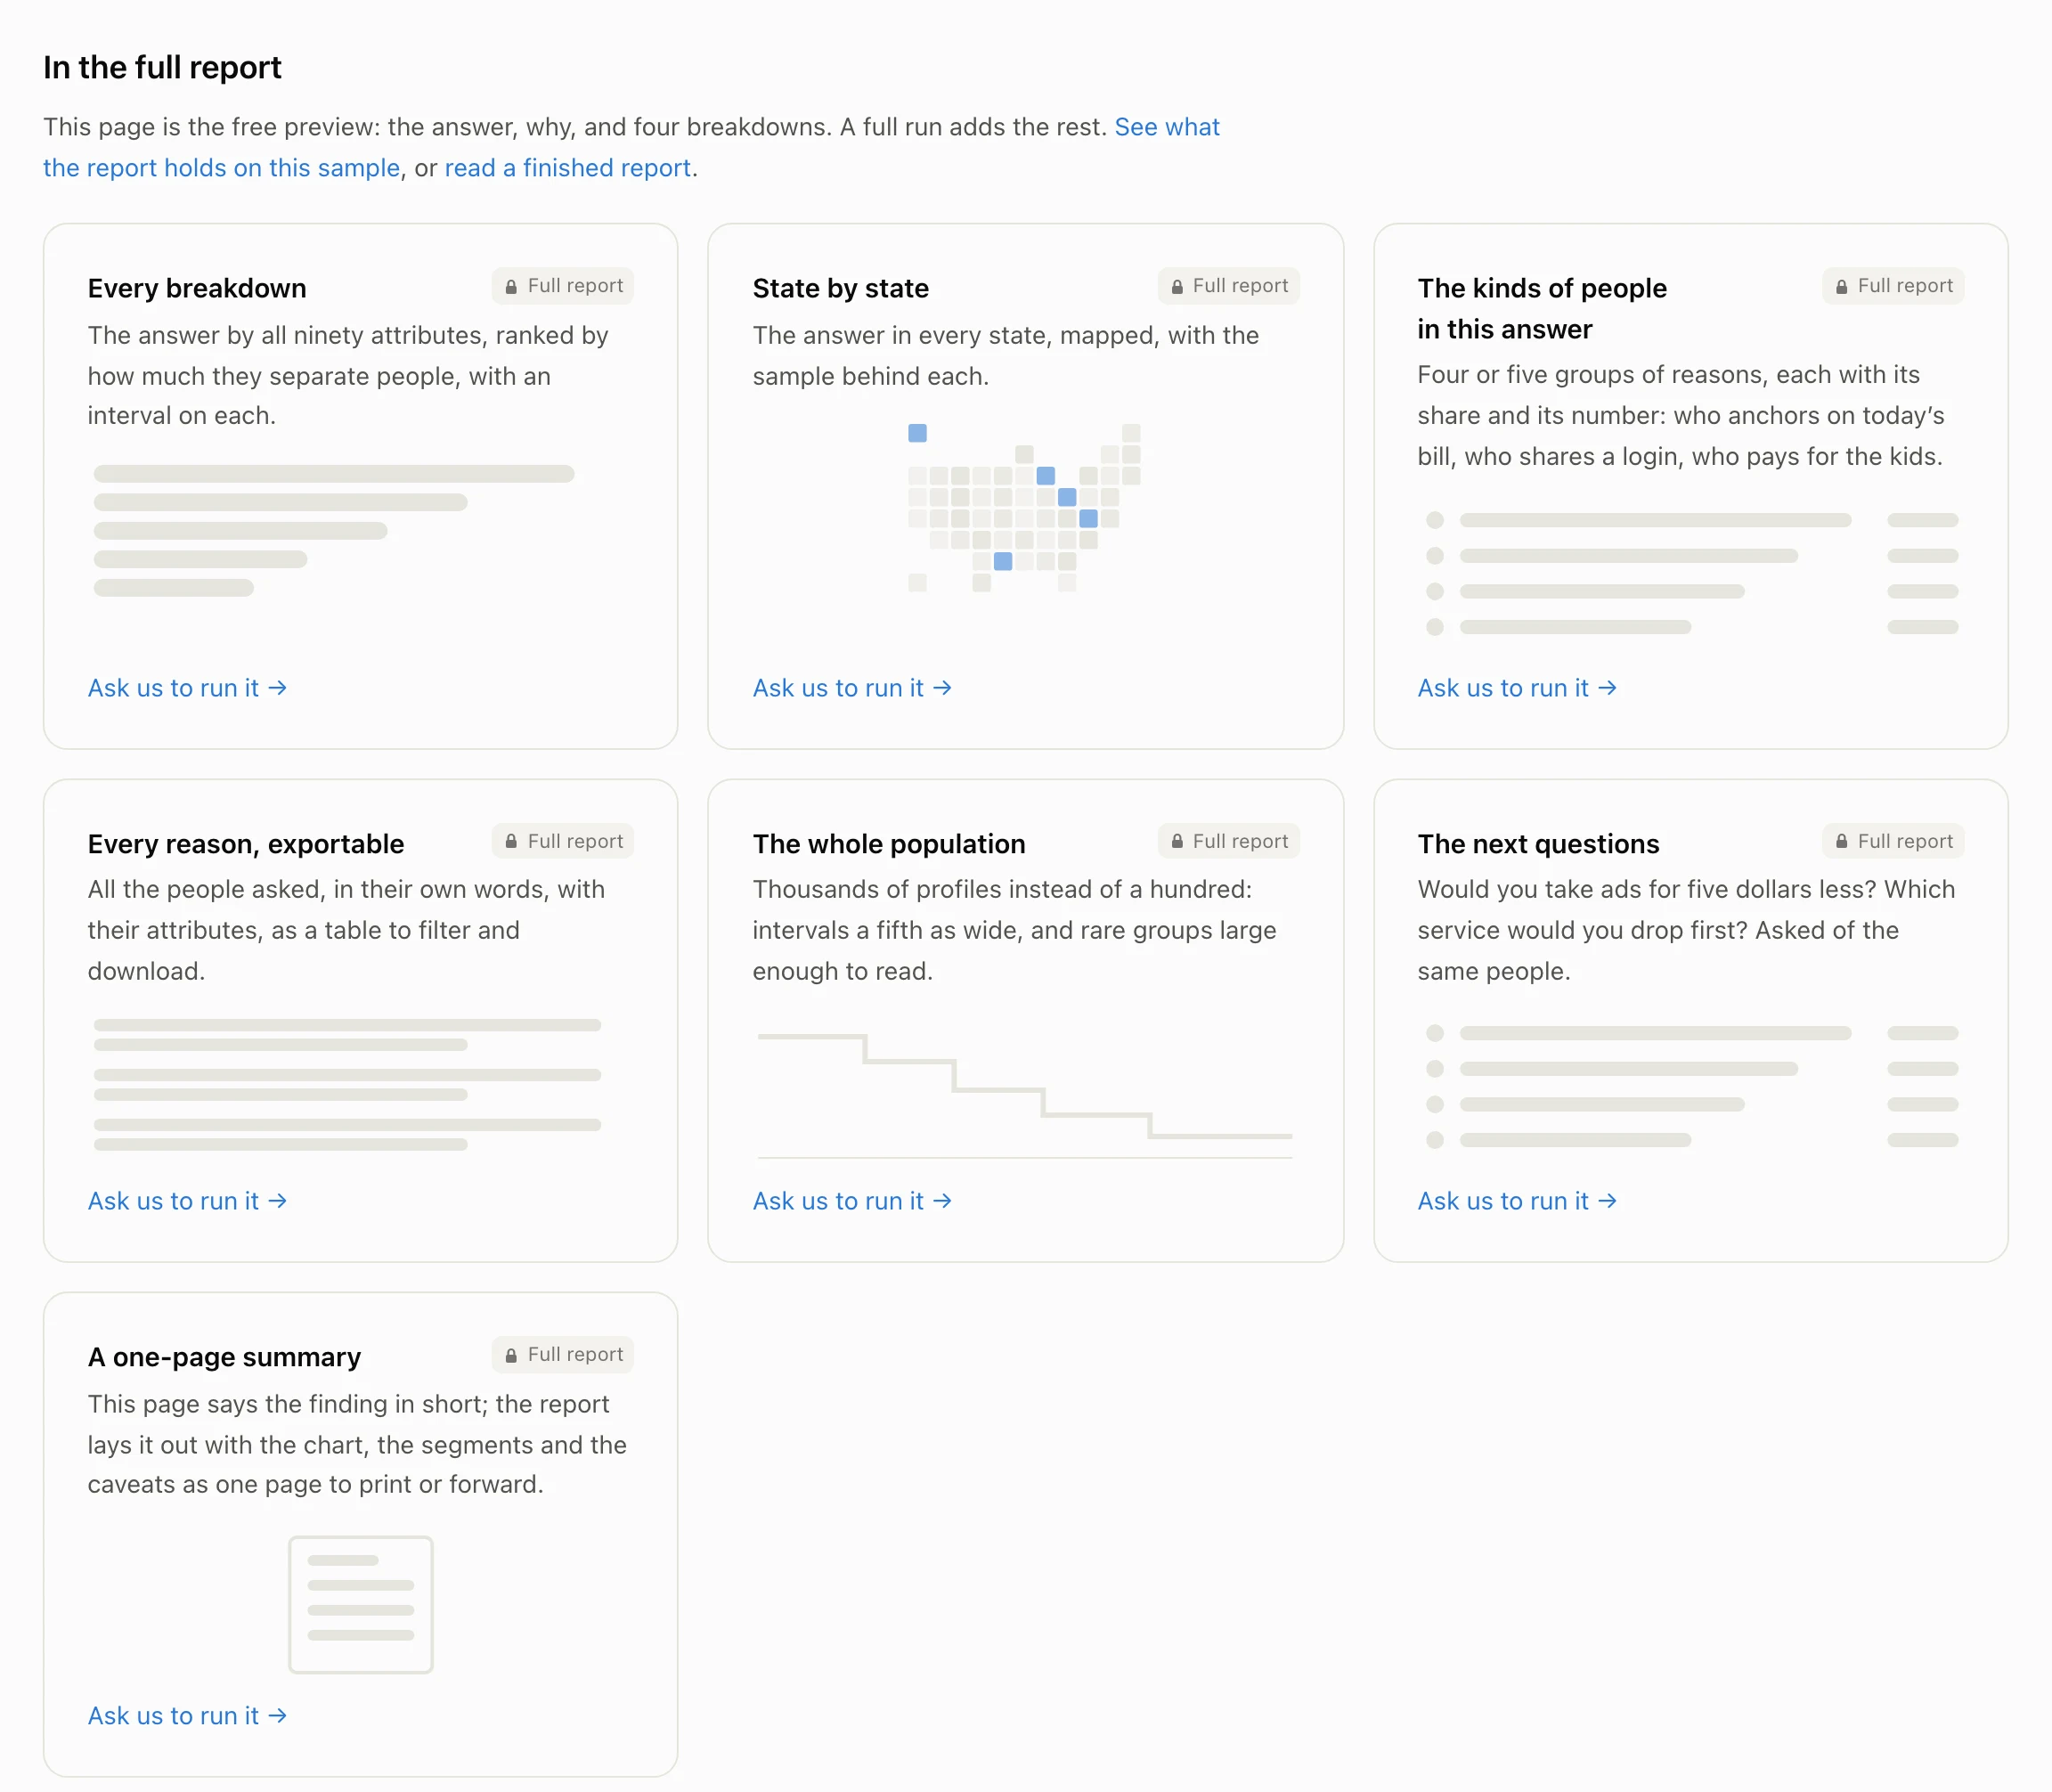
The free preview is the answer with its interval, who answered what, and why. A full run adds every breakdown the record allows, the states on a map, the market the answer implies, the kinds of people, every reason, and the next question asked of the same people; it prints as one document.
Four finished reports are public, so you can read what a full run looks like before asking for one.

What a full report holds

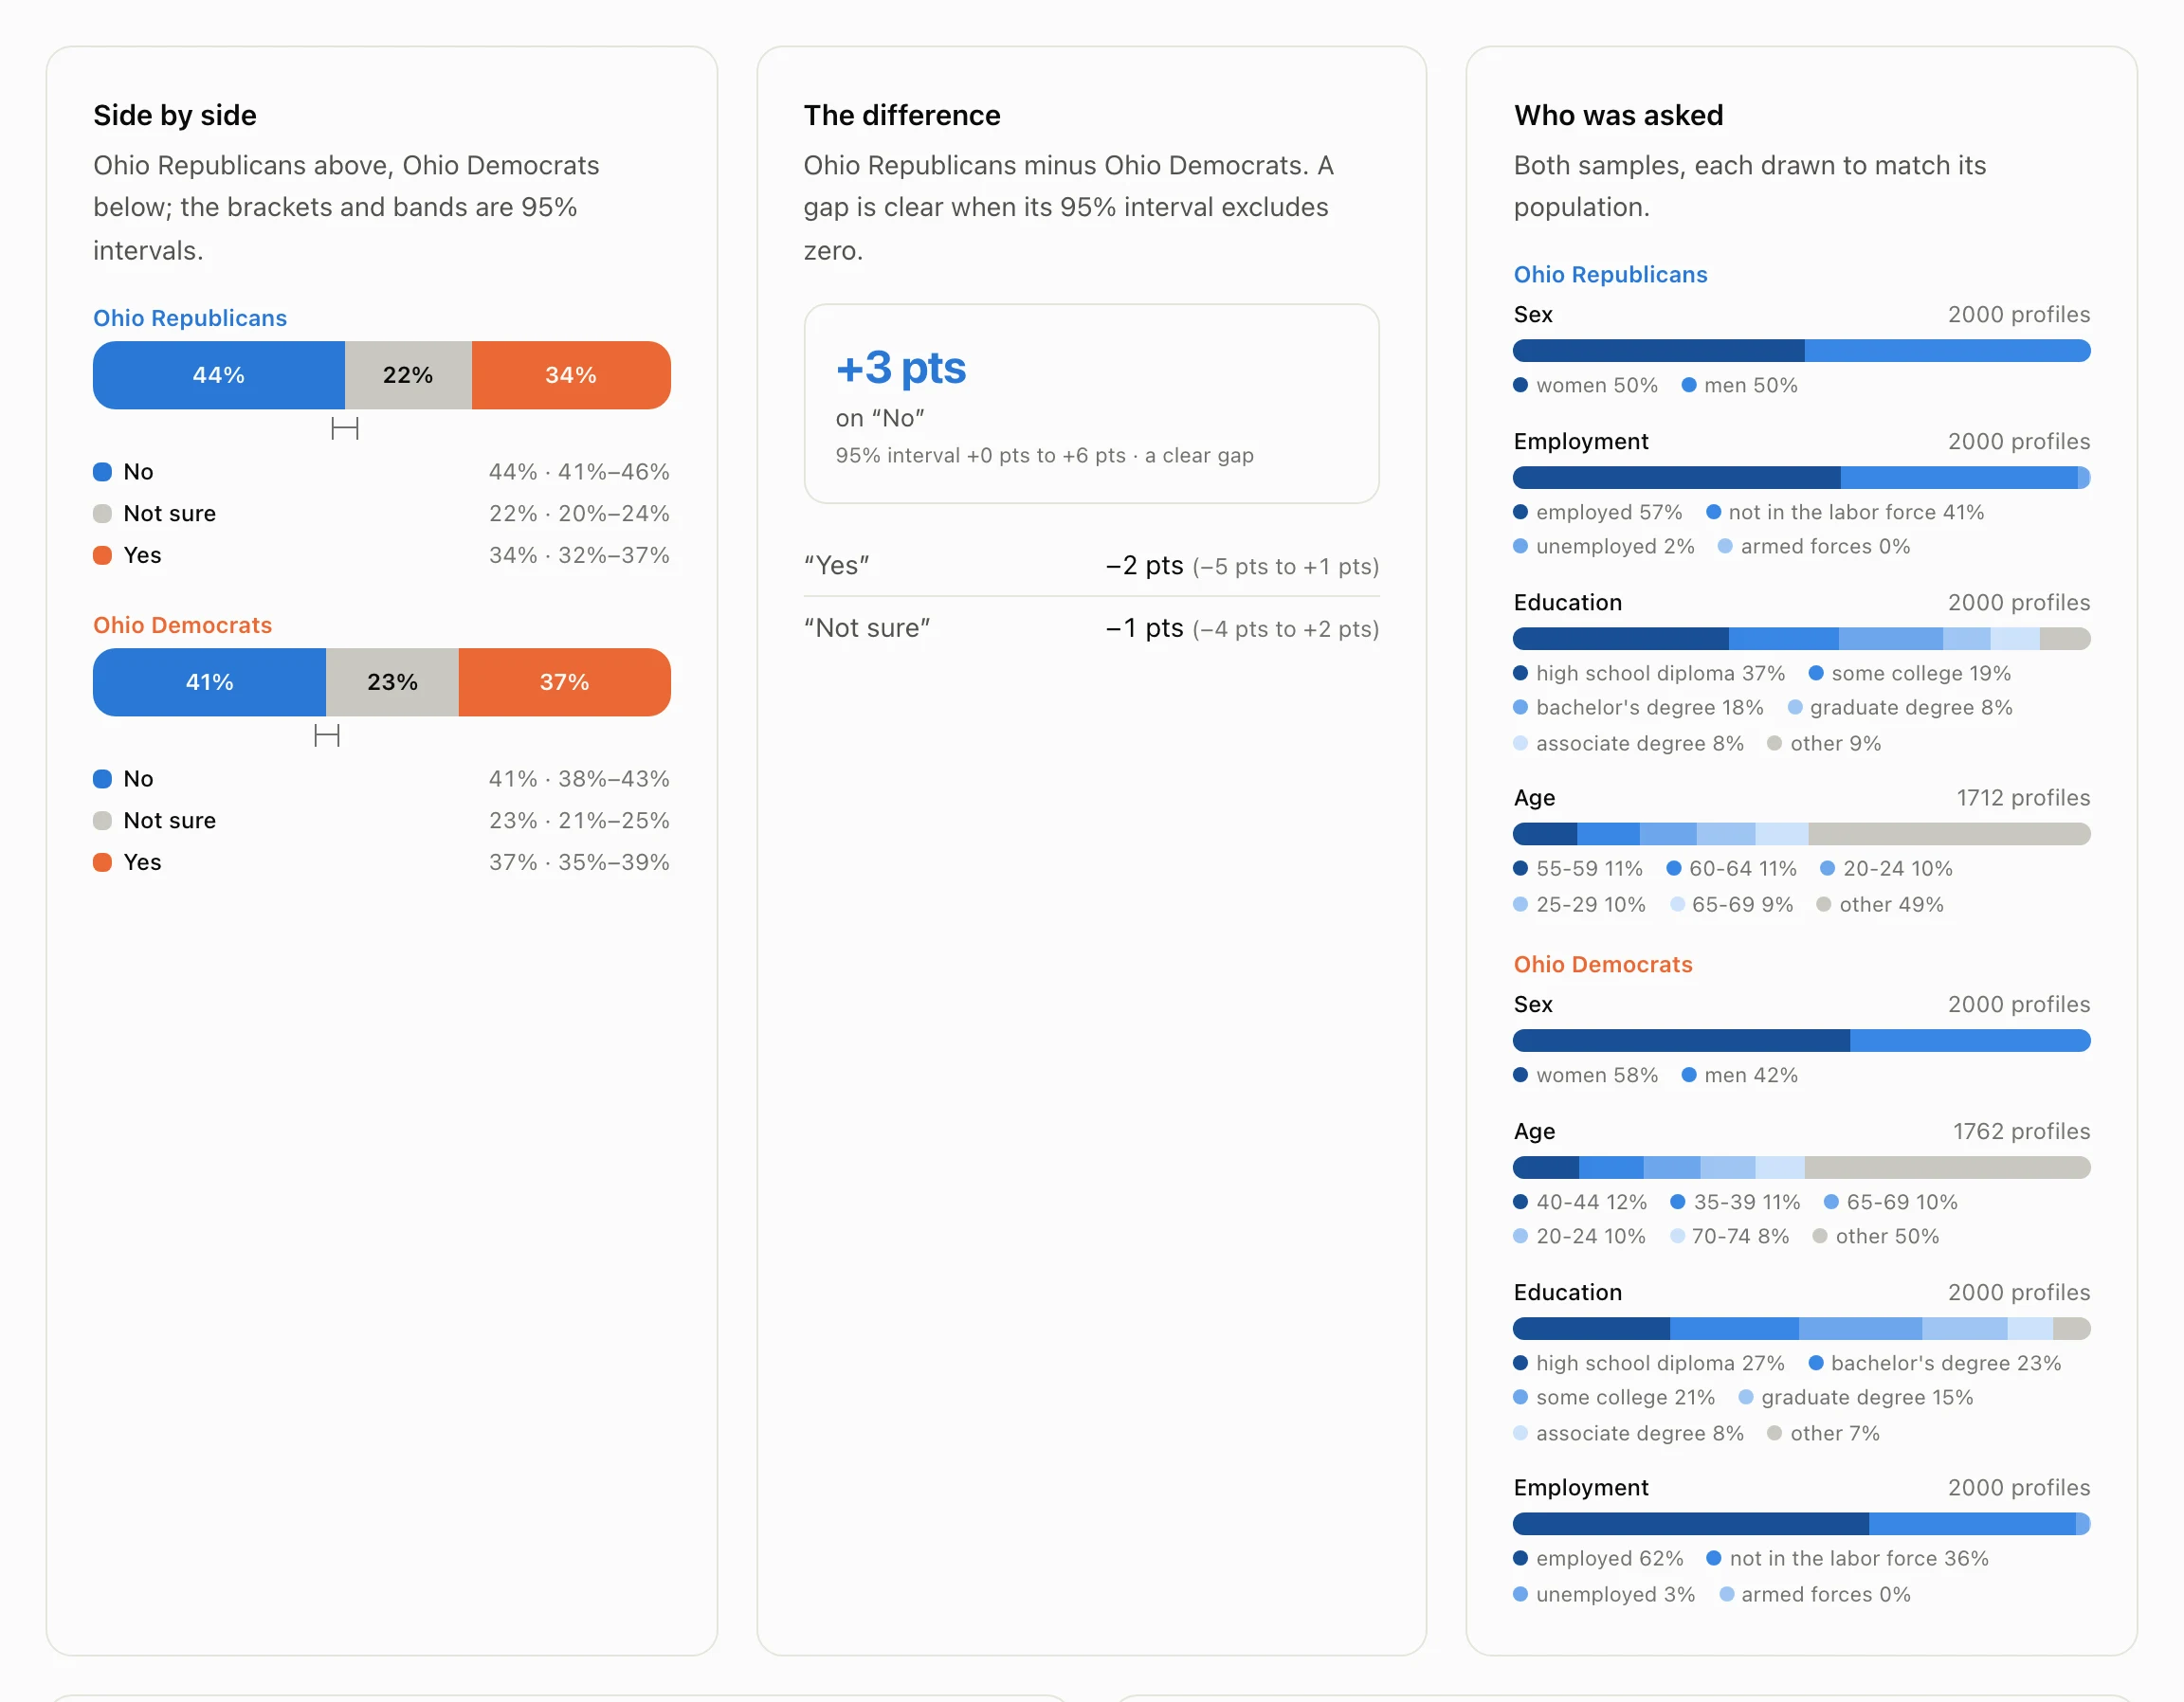
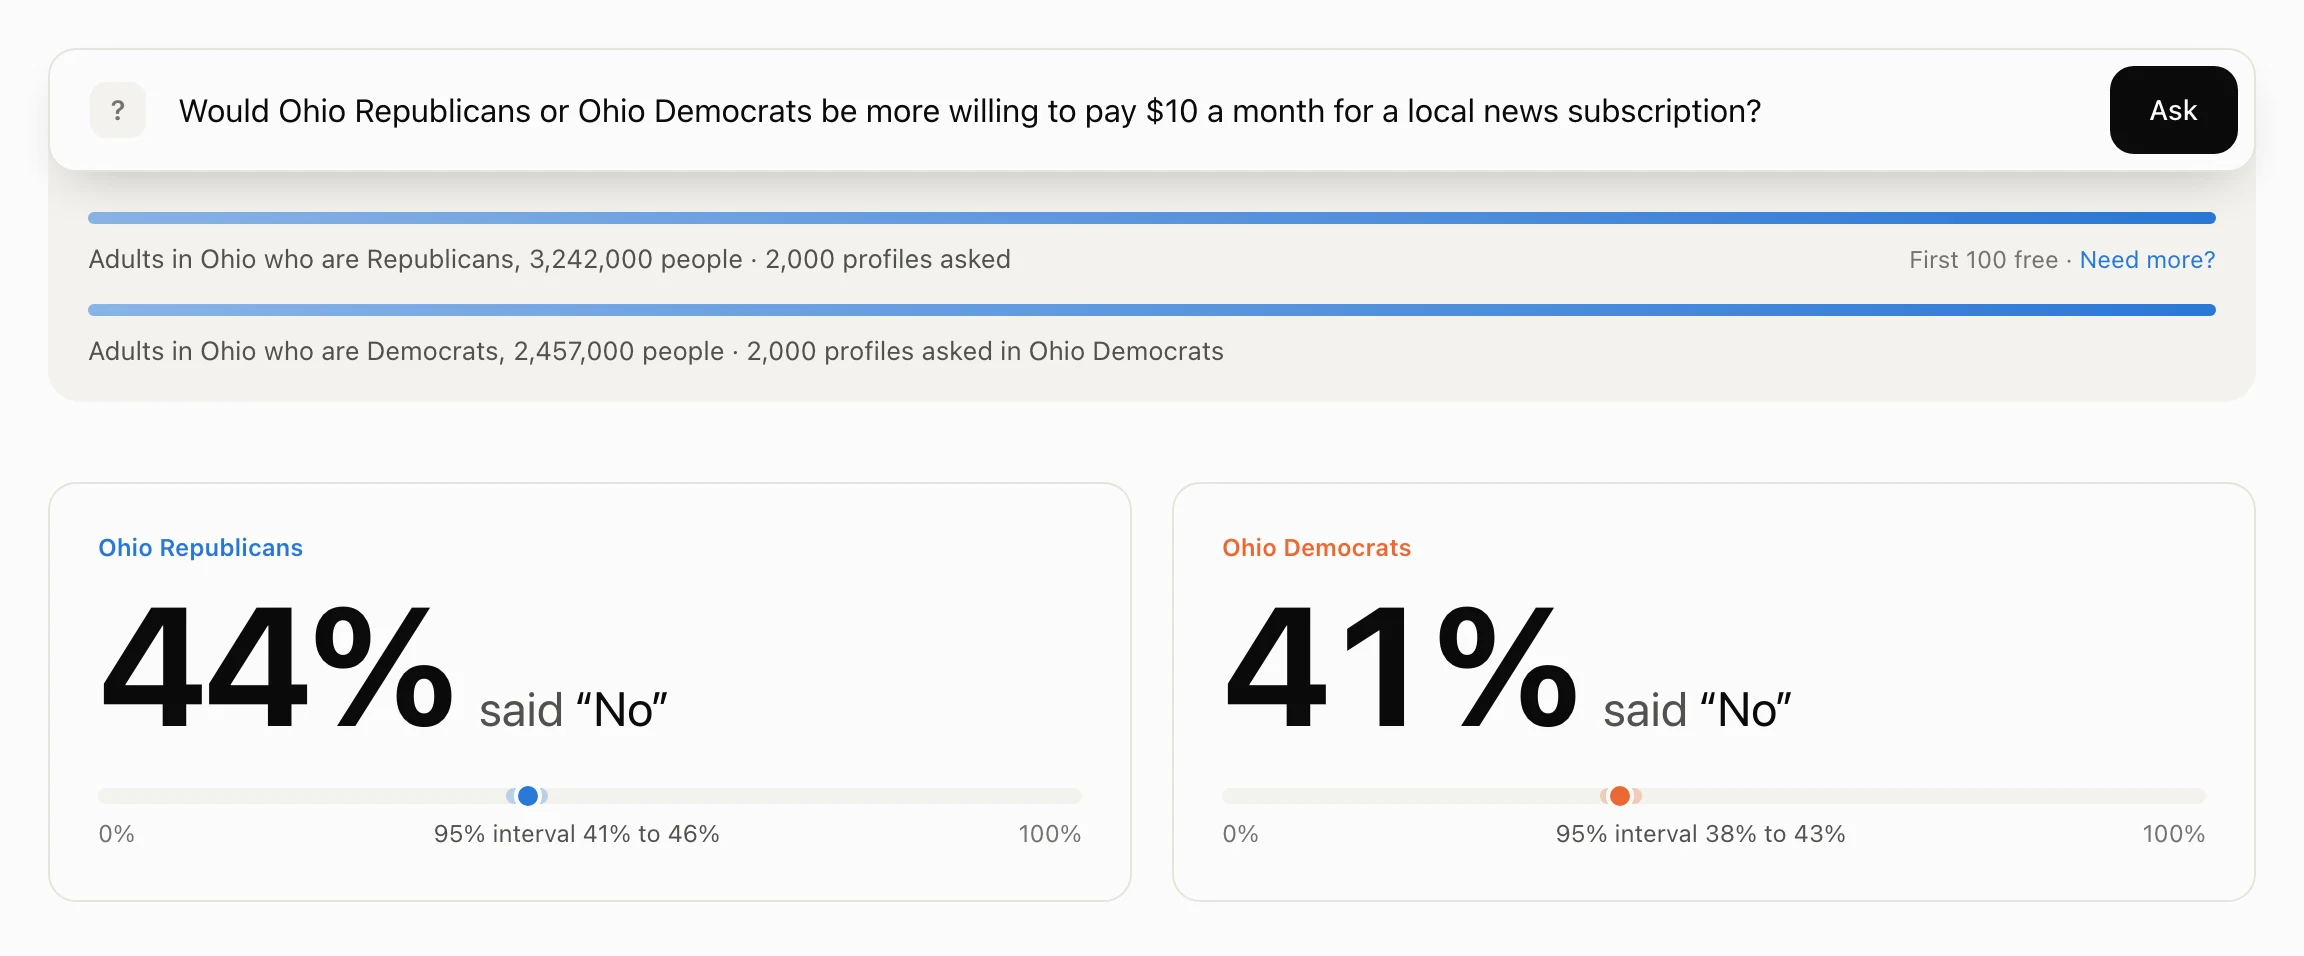
The free sections and the ones a full run adds. Read a finished one: what people would pay a month for a streaming service, whether Ohio's self-employed would pay $50 a month for an AI bookkeeper, whether Ohio Republicans or Ohio Democrats would pay $10 a month for local news, what matters most when choosing where to buy groceries, ranked.

The full report

What this free preview shows, and what a full run adds.

  1. The answer with its intervalIn this previewThe estimate, its 95% interval, and how it settled as more people were asked.
  2. Why they answered this wayIn this previewA reading of what drives the split, with a handful of the people asked in their own words.
  3. Who answered whatIn this previewThe answer by sex, age, education and employment, against everyone.
  4. The demand curveIn this previewThe share who would pay at least each price, and where price times share peaks.
  5. ·Demand by segmentFull reportThe curve and its peak for every group: households with children, under-30s, each income band, each state.
  6. ·Market size at each priceFull reportHow many people the shares stand for: the adults who would pay $10, $15 or $20 or more, in millions.
  7. ·Every breakdownFull reportThe answer by all ninety attributes, ranked by how much they separate people, with an interval on each.
  8. ·State by stateFull reportThe answer in every state, mapped, with the sample behind each.
  9. ·The kinds of people in this answerFull reportFour or five groups of reasons, each with its share and its number: who anchors on today’s bill, who shares a login, who pays for the kids.
  10. ·Every reason, exportableFull reportAll the people asked, in their own words, with their attributes, as a table to filter and download.
  11. ·The whole populationFull reportThousands of profiles instead of a hundred: intervals a fifth as wide, and rare groups large enough to read.
  12. ·The next questionsFull reportWould you take ads for five dollars less? Which service would you drop first? Asked of the same people.
  13. ·A one-page summaryFull reportThis page says the finding in short; the report lays it out with the chart, the segments and the caveats as one page to print or forward.
Ask us to run it →
07

Limits, and where this goes

The population knows what people report, not what they bought or clicked. Amounts are the weakest kind of question, where the model gives rounder numbers than people do. The build is a snapshot at 1 July 2025 and has not read this morning's news. Outside the United States the record is shallow. Attitudes are simulated and checked, never stored as facts about anyone.

Where this goes: a population you can follow, the same people asked again after the price changed or the policy passed; households that decide together; other countries with the depth the United States has now; a population grounded in what people do as well as what they say, from interviews and transactions, as that data arrives; and a population tested against launches, elections and markets, corrected where it is wrong.

Your own world

Bring your data and get a population built for you alone.

Your customer lists, your surveys, your transactions or telemetry become a private population: matched to the same census frame, checked the same way, never mixed with anyone else’s and never part of the public population. Ask it what you would ask your customers, before you ask them.

Get in touch about your own world

Three ways to get an answer

Recruit a panel, prompt a model, or ask a calibrated population. They differ in what the answer is grounded in.

A survey panelPersonas from a promptcensus.world
Who answersRecruited respondents, weighted afterwardsCharacters a model invents from a descriptionOne synthetic profile per resident, built from census and survey records
Representative ofThe panel, after weightingWhatever the prompt impliesThe population, cell by cell: state, age, sex, race, origin, education, work, income, household, health
Sampling intervalYesNoYes, on every number, narrowing as more profiles are asked
Checked againstItselfUsually a handful of past surveysOfficial tables held out of the build, real survey answers by demographic group, open markets
ReproducibleNo: a new field, a new sampleNo: a new prompt, a new crowdYes: versioned builds, the same person in every build of a lineage
TimeWeeksMinutesMinutes, with the interval shown as it forms

Standing on known methods

Nothing here is a new idea. The population is built with methods statisticians have used for decades, applied end to end and checked at every step.

  1. 1940
    Iterative proportional fitting
    Deming and Stephan's method for adjusting a table to known margins; the basis of raking in survey weighting ever since.
    In census.world today
    American Community Survey records are raked to every state's census cell counts and to published tables, so each state's education, work and income structure matches what the Census Bureau reports.
  2. 1996
    Synthetic populations for microsimulation
    Beckman, Baggerly and McKay's synthetic baseline populations for transport models: survey records expanded to a whole population that matches census constraints.
    In census.world today
    One synthetic profile per resident, carrying the survey's joint structure rather than independently drawn attributes.
  3. 2009
    Held-out validation of synthetic populations
    The practice, common since the population-synthesis literature of the 2000s, of scoring a synthetic population on tables it was not fitted to.
    In census.world today
    Every build predicts employment, marital status, veteran status, disability, insurance, citizenship, occupation, industry, commute and enrollment tables it never saw, and reports the error per state.
  4. 2023
    Language models as simulated respondents
    Argyle and colleagues' finding that a language model conditioned on a real respondent's demographics reproduces survey response patterns, and the wave of work testing where that holds and where it fails.
    In census.world today
    Each profile answers in character from its own record; the answers are checked against real surveys by demographic group, and the page says how far off that kind of question tends to be.
Ask a question · Every check, with its number · What’s new