The world model
Our foundation model starts from public data and our proprietary surveys. Bring your own data, and it builds a private world on top that only you can ask.
Your own data
Bring your customer lists, surveys and transactions, and we tune a private copy of the population to them. It stays in your own account, and we never train on it.
Our proprietary data
Surveys we field ourselves, as they arrive, put the questions public data never asks to real people and weight their answers to the same census frame as everything else.
Public data
The UN counts every country's people; the Census Bureau, the American Community Survey, the Current Population Survey and Eurostat add detail, checked against tables the model never saw.
The population
One population of the whole world, built before anyone asks: synthetic people standing for 8.2 billion in 231 countries and areas, with 317 attributes between them, matched to what is published about the people who live there. The charts are its own counts, read live.
Everyone in the United States, by age and sex
Every resident by five-year band, women on the left and men on the right; the census, cell by cell.
A bachelor's degree or more, adults 25 and over
One attribute from the survey record, read live for every state; each state matches its published table.
Employed, by age: women and men
Two traits that move together with a third, kept together because every American profile is one record.
Aged 65 and over, by country
The share of each country's people aged 65 and over, from the UN's estimates: the same population, everywhere.
Every attribute, with its source and the share of people in each value
One population and one tree: open a family, then an attribute, to see its values and how people split across them. The tree goes deeper where the data does, and each attribute says where it applies.
Place
Where they live, from the country down to the county.
Person
Who they are: age, sex, race, name, marriage and service.
Origin and language
Where they were born, their ancestry and the language they speak at home.
Education
How far they went in school, and whether they are still studying.
Work
Whether and how they work: the job, the hours, the pay and the commute.
Money
What they earn, what they spend and how they make ends meet.
Household and home
Who they live with, and the home they share.
Health
How healthy they are, the care they get and how they feel.
Civic and political life
How they vote, what they believe and how they take part.
Individuals, not averages
Every profile is an individual actor with one coherent life: age, work, income, family and beliefs that belong together, built from real records. Each answers as itself, and the result is added up from thousands of individuals instead of guessed for a segment, so it keeps the detail an average would lose, down to a small group.
The population is unavailable right now.
It starts with a question…
A question in plain words becomes a design before anyone answers: who it is asked of, the wording each person hears, the kind of answer and its options. A yes or no, a choice, an amount, a ranking, or two audiences side by side.
“What would you pay a month for a streaming service?”
Pick the audience
The people whose answers are worth the most are the hardest to reach: few, busy, offline or abroad, and a panel rarely has enough of them. In the population every group is there in proportion, so the hardest audience is as easy to ask as everyone.
Few, busy and rarely on a panel: the people behind most premium purchases are the ones a survey reaches least.
Who they are
The make-up of the audience, from the 65,941 profiles in the population that stand for it.
Where they live
The share of each state's adults who are in this audience.
Among the hardest groups for any survey to reach, and the one every consumer brand wants to hear from.
Who they are
The make-up of the audience, from the 162,875 profiles in the population that stand for it.
Where they live
The share of each state's adults who are in this audience.
Largely offline, so an online panel barely reaches them, and a phone survey reaches the few who still pick up.
Who they are
The make-up of the audience, from the 149,334 profiles in the population that stand for it.
Where they live
The share of each state's adults who are in this audience.
A market larger than most countries that no American panel reaches, asked in the same frame as everyone else.
Who they are
The make-up of the audience, from the 123,110 profiles in the population that stand for it.
Where they live
The share of the age group who are in this audience, in the ten states where it is highest.
The simulation
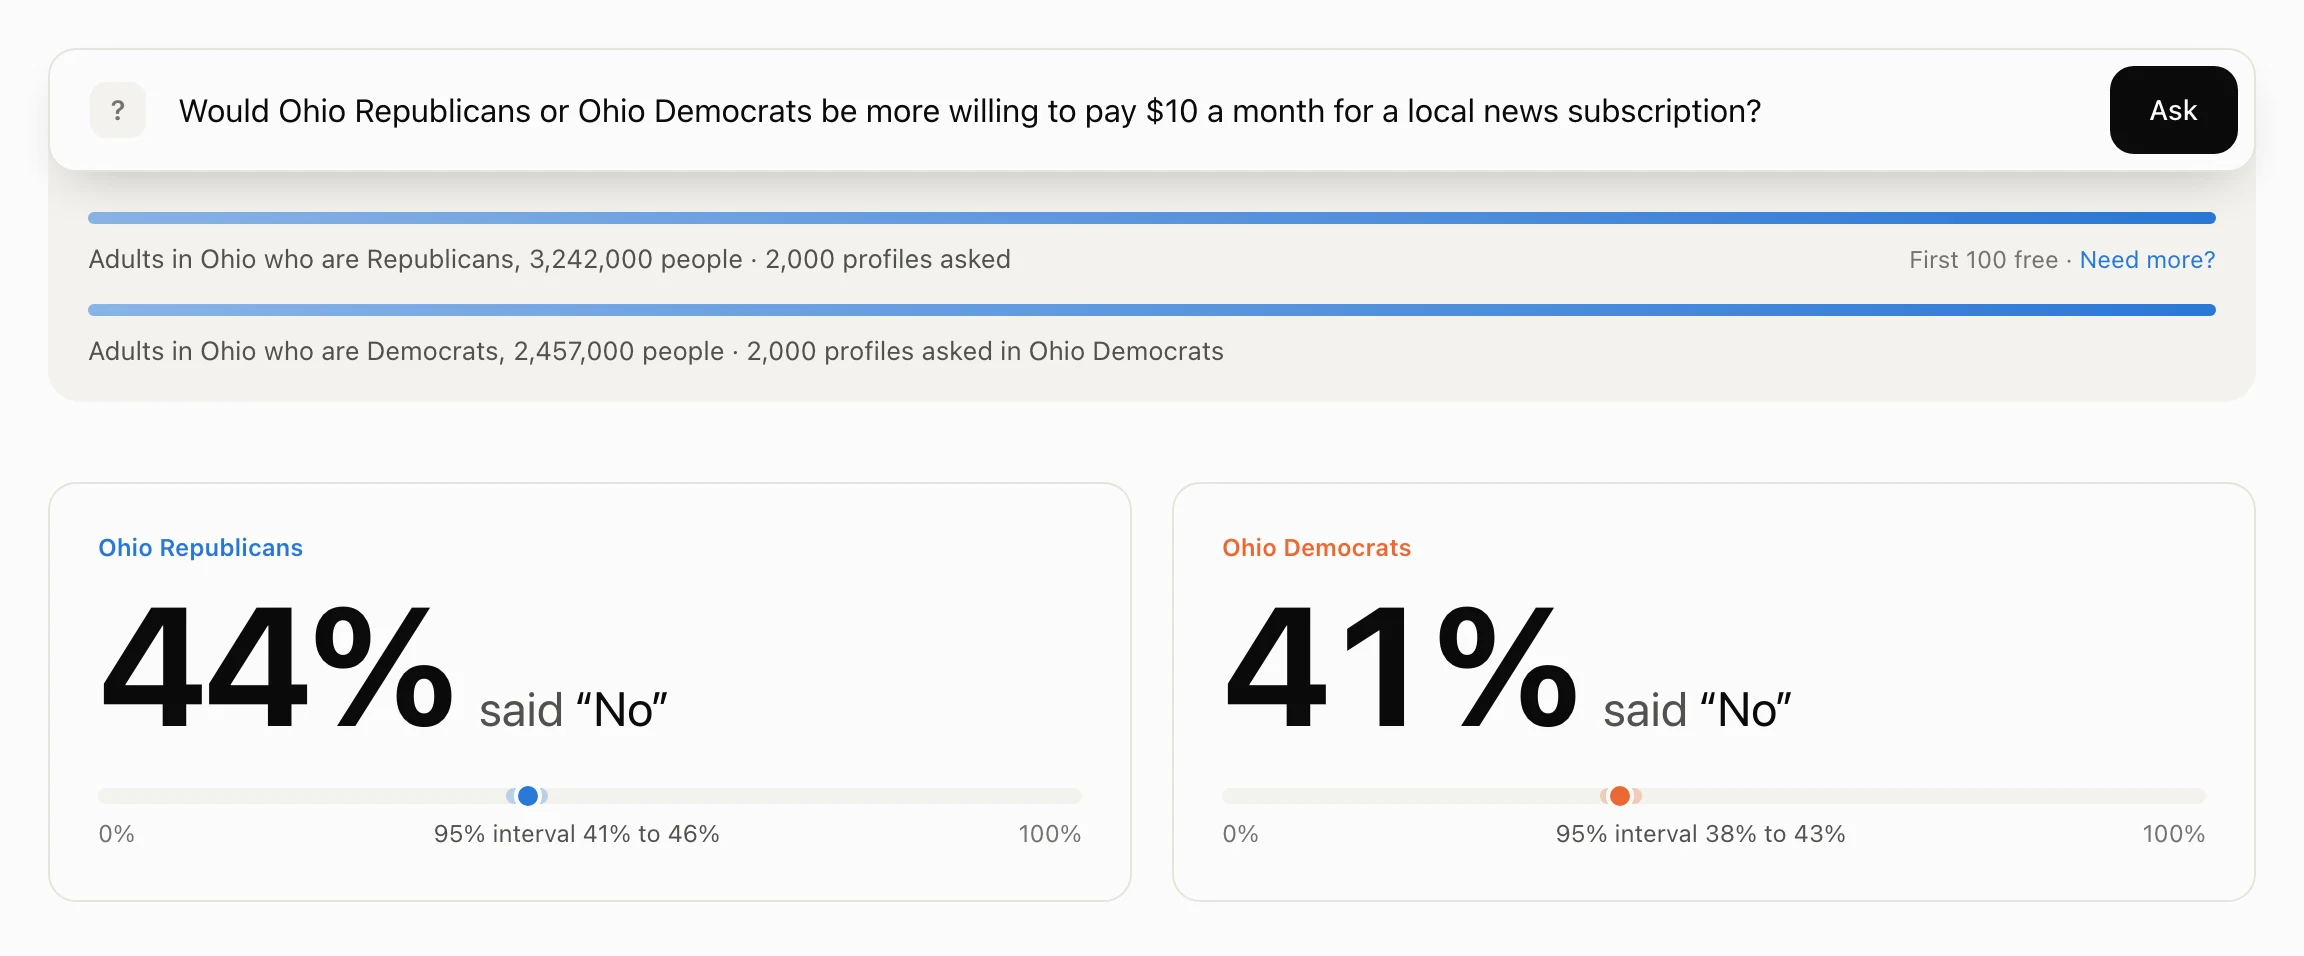
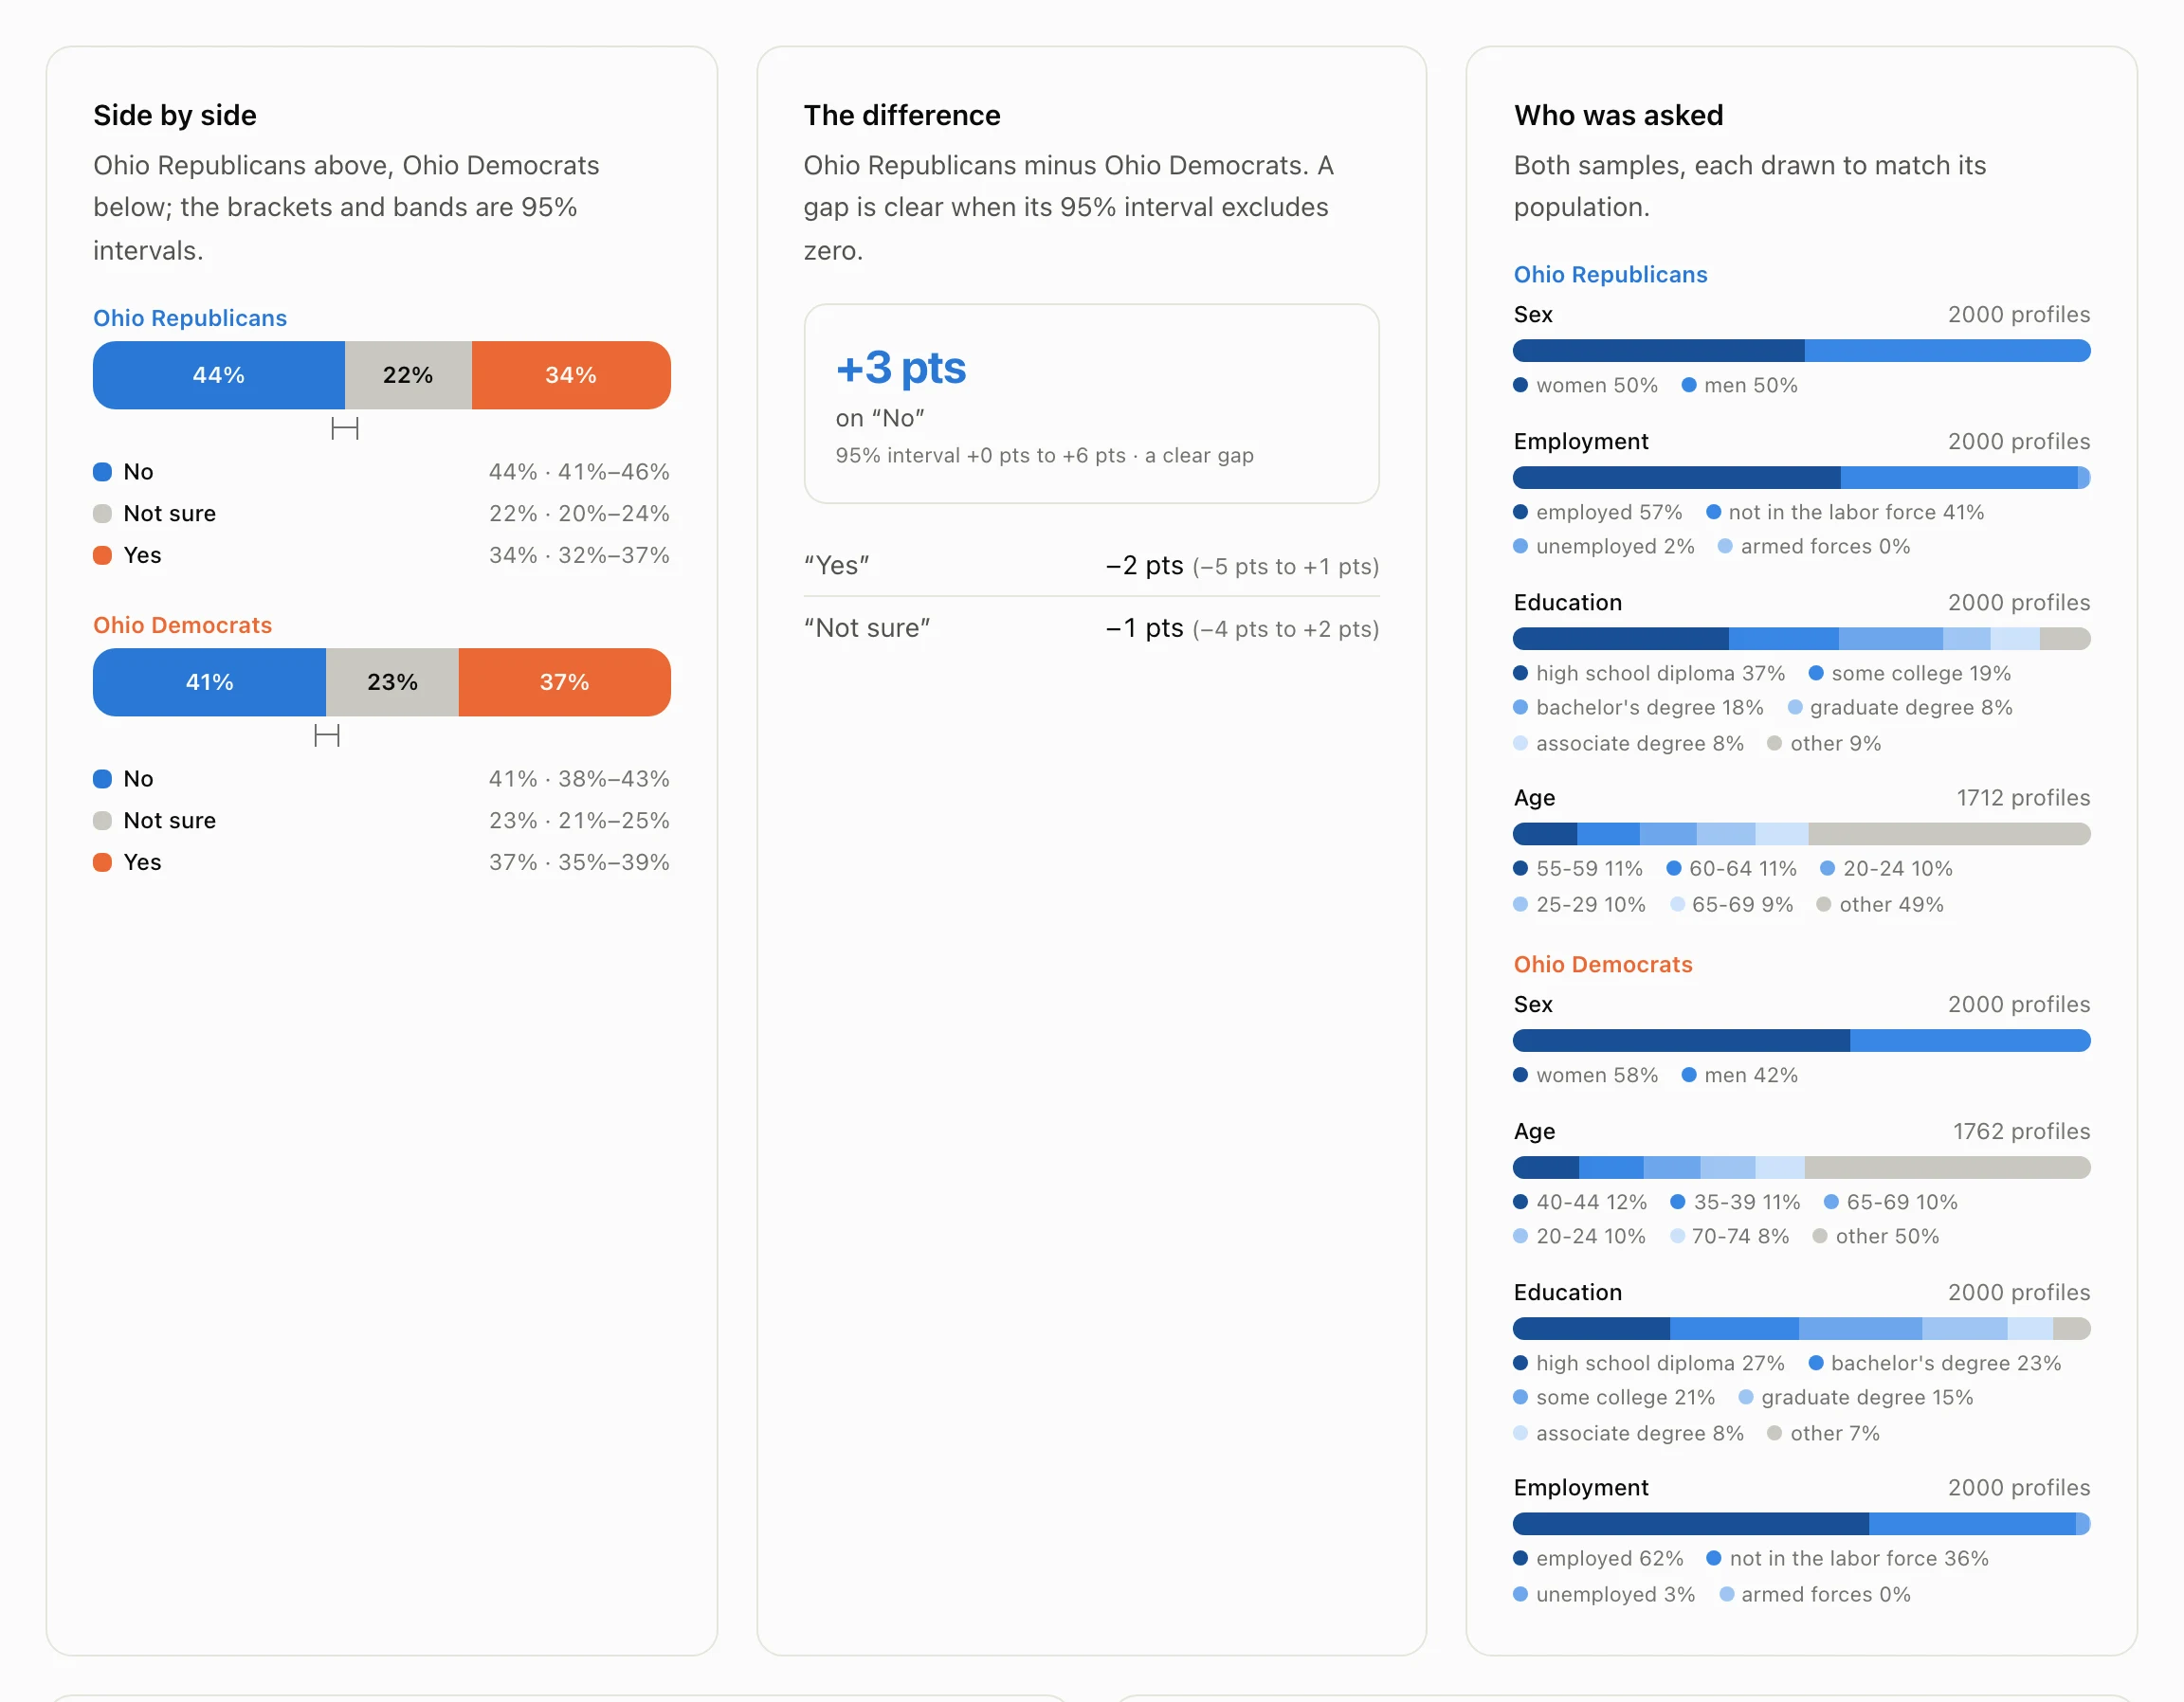
Each person in the sample answers as themselves, one at a time, and the answer comes back with its interval, who answered what, and why.
Build your own world
Bring your data and get a population built for you alone.
Your customer lists, your surveys, your transactions or telemetry become a private population: matched to the same census frame, checked the same way, never mixed with anyone else’s and never part of the public population. Ask it what you would ask your customers, before you ask them.
Get in touch about your own world